Introduction
In the AI era where compute equals productivity, any GPU failure could interrupt millions of training cycles, and any link jitter could paralyze real-time inference services. At Canopy Wave, we understand stable computing resources are important, even more than peak performance. Built upon three industry-leading, cloud-native tools—Prometheus, Grafana, and Alertmanager—our cutting-edge intelligent monitoring system transforms reactive daily firefighting into a proactive, structured defense strategy. Backed by Canopy Wave's 24/7 operations team, we guarantee the stability and performance of your critical systems.
Prometheus: Comprehensive Metric Collection Engine
• Utilizes a powerful Pull-based model to actively monitor a vast array of targets, including Kubernetes clusters, servers, databases, middleware, and custom applications.
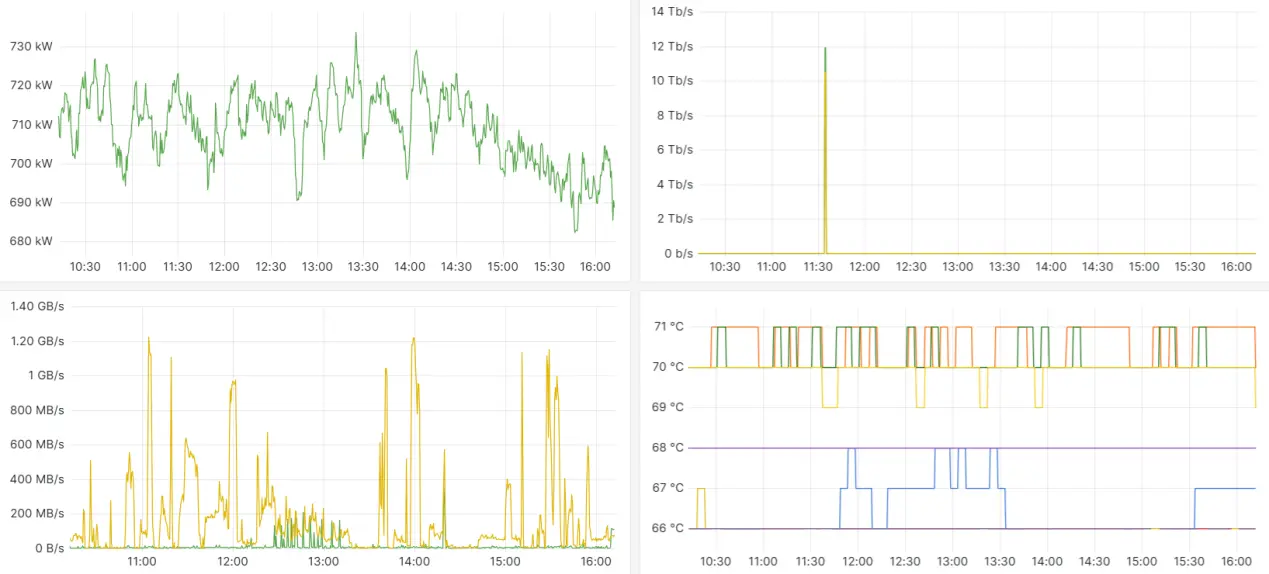
• Built-in powerful temporal database, efficiently storing and processing multi-dimensional indicator data such as CPU/GPU usage, memory consumption, network throughput, disk I/O, temperature, link jitter, etc.
• Provides the flexible PromQL query language, enabling real-time aggregation, deep-dive analysis, and historical review to precisely identify performance bottlenecks.
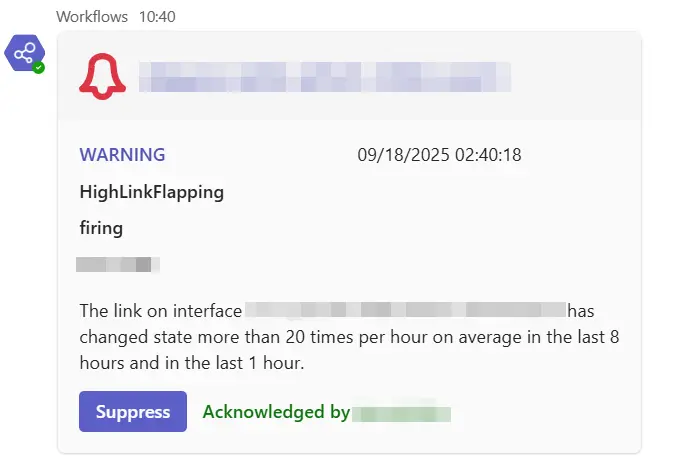
Alert Manager: Intelligent Alerting Governance Center
• Automatically triggers alert events based on predefined rules in Prometheus (e.g., CPU temperature exceeding 90°C for over one minute).
• Implements intelligent alert grouping, routing, and suppression. It consolidates similar alerts for clear notification, directs them to the right support personnel (e.g., via Microsoft Teams) based on service, environment, or severity, and enables a swift response to prevent major incidents and resolve hardware failures.
• Supports silencing strategies and delayed notifications to effectively filter out transient fluctuations and non-critical events, ensuring that every alert is both reliable and actionable.
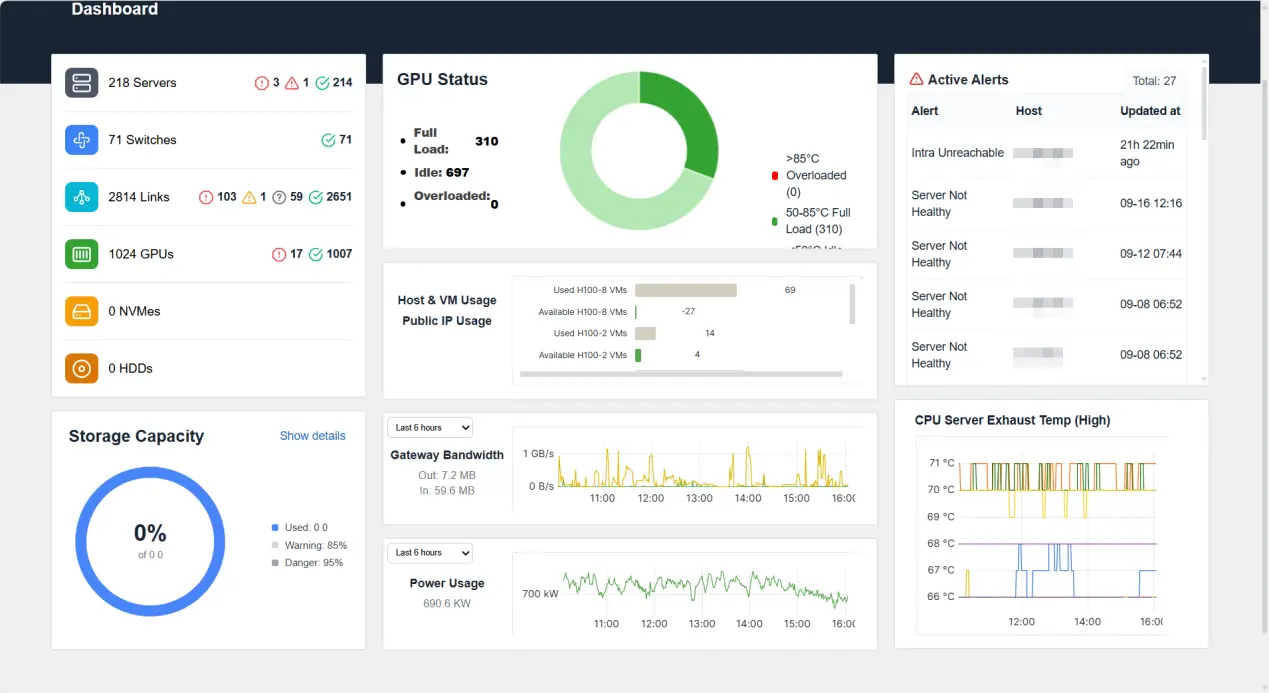
Grafana: Dashboard with Visibility
• Offers a drag-and-drop dashboard builder that integrates data from Prometheus and dozens of other sources into a single, unified monitoring view.
• Presents resource trends, service status, and overall business health through rich, intuitive visualizations, including line charts, heatmaps, and customizable panels.
• Supports multi-tenant permission management, providing tailored views for development, operations, and management teams, effectively breaking down data silos.
Conclusion
In the era of data-driven decision-making, invisible risks are the biggest cost. Canopy Wave intelligent monitoring platform, with Prometheus + Grafana + Alert Manager as the core, lays the operation and maintenance highway from indicator collection, intelligent alarm to panoramic visualization for you.

